LIDARs (Light Detection and Ranging) are starting to be well known in the many industries as an alternative to traditional meteorological masts. Nevertheless, our clients often ask us:
- What are the benefits and challenges of using lidars?
- How do these small, remote sensing devices work?
- For which applications can lidars be used?
In this article, we present some of our most interesting projects as case studies, including setups used, lessons learned and challenges we have seen.
Long experience in cold climate and complex terrain
Kjeller Vindteknikk has almost 15 years of experience working with lidars. Over the years, we have performed approximately 35 lidar measurement campaigns, some of them in highly complex terrain and mountainous environments.
Benefits
One of the main advantages with lidars is that lidars are easy to move. In one of our projects, a lidar was first validated against a closely located mast, and then moved every couple of months to cover a very large area. This data could then be used to minimize the horizontal extrapolation uncertainty of wind modelling in energy yield assessment analyses for the planned wind farm. Lidars are also able to measure higher than with a met mast at lower costs.
Lidar technologies – how do they work?
Briefly explained, lidars sends out a laser beam with a known frequency into the air. The air has small particles, aerosols, that reflects the light back to the lidar. If the particle moves along the direction of the laser, the frequency of the light will change, hence the wind velocity component along the beam can be calculated. The measurement height can be controlled in two ways: either by sending the light in pulses and measure the time, or by fucus though a lens.
We can divide lidars into two categories: vertical lidars and scanning lidars.
Vertical lidars use different beams pointing upwards to measure different velocity components in a volume of air. The components of all beams are then used to calculate the direction and velocity of the wind.
Scanning lidars are similar to vertical lidars but can be controlled more freely to measure at different directions. The laser beams are also much stronger, making it possible measure substantially larger distances and ability to measure turbulence. This makes the scanning lidar capable of contributing to advanced setups. They cost a bit more compared to vertical lidars.
For both vertical and scanning lidars, it is good to be aware that lidars do not have a 100 % data availability at a desired measurement height which is typical to all remote sensing devices.
Wind energy case study – Validation against met masts
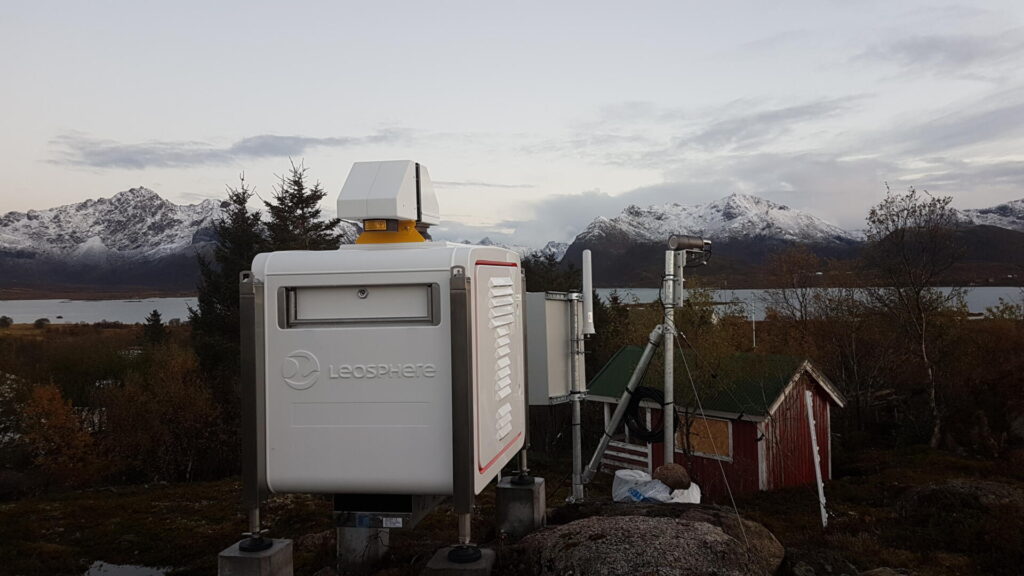
Recently, we have had several projects when vertical lidars were installed and measurements validated against met masts. One of the sites is located in Lithuania, covering a full year. The site is located on farmlands with nearby forest. The reason for the validation is to be able to use the lidar measurements at higher altitudes instead of the more common method by vertically extrapolate the mast data.
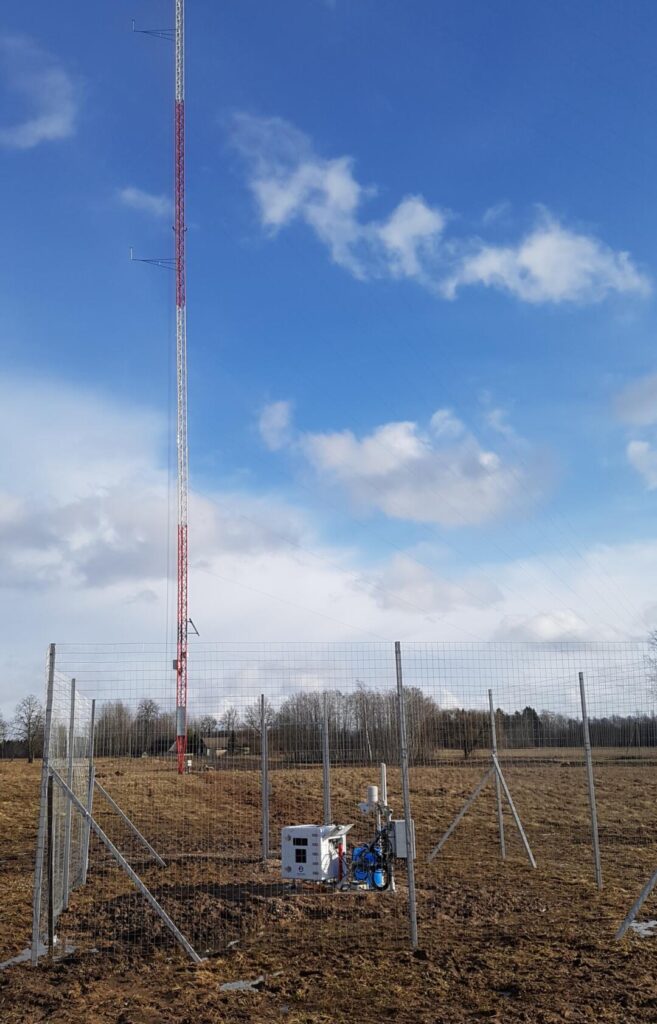
Lidar installed side-by-side to a validation met mast.
When installing lidars for comparing against masts, there are several essential details to consider. One example is that it is an advantage to position the lidar as close as possible to the mast, however, without having any interference between the mast and the area measured by the lidar. Simo Rissanen from Kjeller was in charge of the installation. “The installation went well, and we didn’t have any large challenges”, he says. “During operation, the only challenge was that the lidar went offline for a couple short periods. We know that the lidars are quite sensitive and we expect the reason to be unstable power grids in the area.”
Another challenge was that the mast was hit by a lightning strike, as masts tends to be sometimes. In this case, this caused an outage for the lidar power. Fortunately, the lightning did not harm the lidar itself in anyway, which shows the importance of having the correct and robust power surge protection systems installed. “After just a couple of days, everything was up and running normally again, collecting data”, Simo says.
Despite the small challenges with grid power supply, the overall data availability for the lidar was 93 % at a measurement height of 140 m. Interestingly, the availability seems to be better in the winter months. According to Simo, one reason might be that the air has more water in it during the winter.
The plot below presents the results from the analysis, showing very good correlation between the lidar and the met mast.
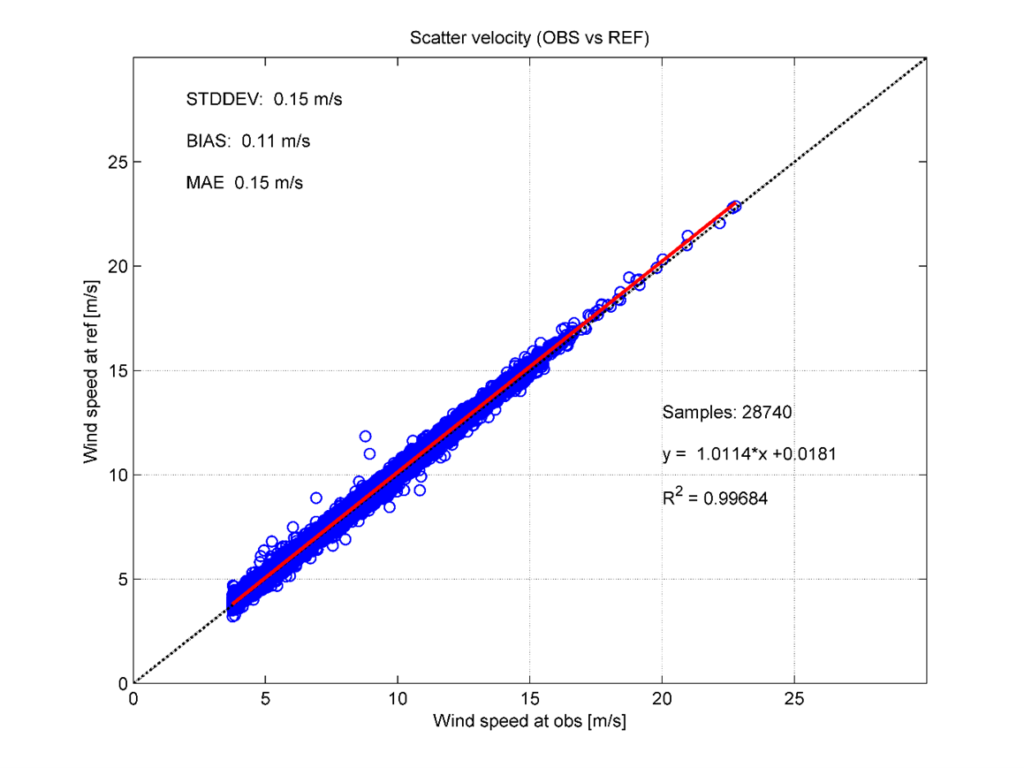
Comparison between met mast and lidar measurements at the same height. Mast on the vertical axis and lidar on the horizontal axis.
Wind Engineering case study – Choosing location for new large airport close to Lofoten
For several years, Kjeller Vindteknikk (KVT) has been involved in the work of finding a new large airport in the area close to Lofoten in Northern Norway. In 2019, Avinor, the Norwegian airport operator, hired us to analyse several possible locations with the use of lidar data. The four main locations that are analysed are Laukvik, Malnes, Gimsøy and Leknes, with several local variations of alternatives.
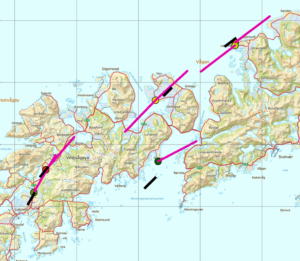
Four locations of scanning lidars.
The project has been a collaboration between KVT (lidar measurements and analysis), SINTEF (terrain model, SIMRA), and Meteorological Institute (Arome model weather data input to SIMRA). SIMRA is used to estimate terrain induced turbulence at airports in Norway.
Hálfdán Ágústsson at Kjeller was in charge of the analysis of the lidar data. “One large benefit of using lidar in this project is that we get data in much larger heights above the ground than we would get with masts measurements”, Hálfdán says. The lidars where used to measure along the approach line for airplanes of typically 3.5 degrees, and by using scanning lidars, we were able to measure good data at long distances up to several kilometres.
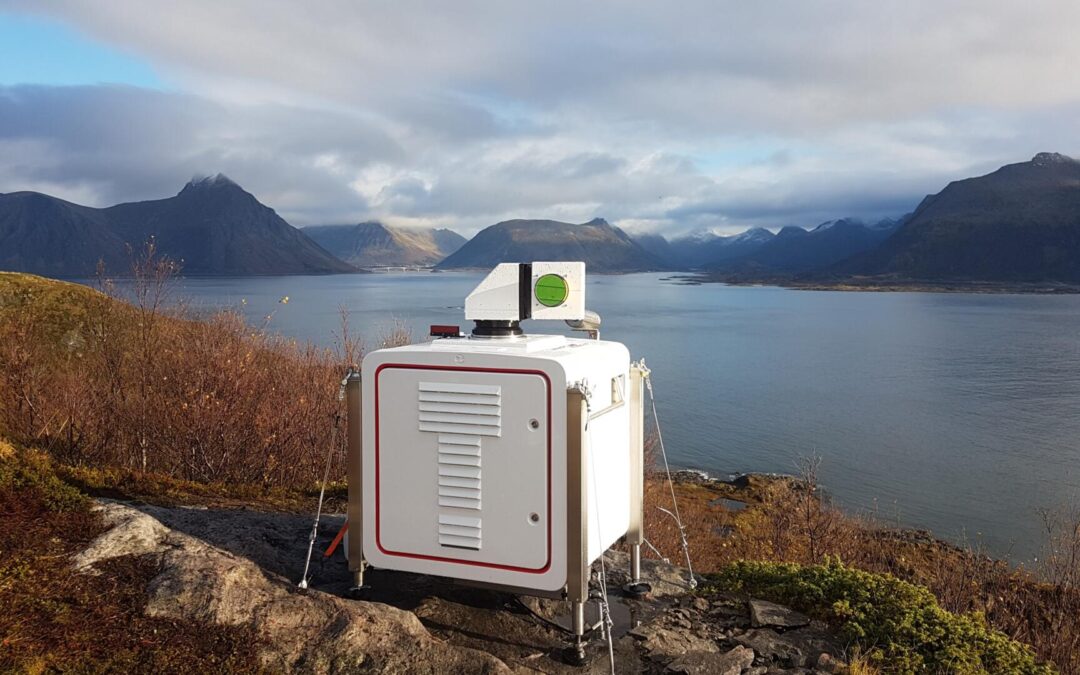
Scanning lidar installation near the new planned airport.
At the considered locations, SIMRA model underestimates the turbulence. “At severe turbulence events, the model underestimates the turbulence with as much as 40 %, and for less severe turbulence the underestimation is smaller”, Hálfdán says. We see that the deviation between the lidar measurements and the SIMRA model varies according to the local terrain. It was therefore important to have good lidar measurements to capture the local terrain effects, along the approach line. The lidar data are then used to scale the SIMRA model for each considered airport location, to get a long time series with better local representation.
Based on criteria from Avinor, including crosswind, turbulence and sight, the suggested locations were narrowed down in several steps. In the last step, more thoroughly analyses of the runway were performed. According to the final results, Leknes had the highest availability (between 94 % and 98 % of the time) and the lowest turbulence and was therefore the chosen location for further development by Avinor. The announcement of the chosen location for the work on a large airport close to Lofoten was published in a press release by Avinor in January 2020.
Avinor press release: https://kommunikasjon.ntb.no/pressemelding/luftfart-avgjorende-for-veksten-i-nordnorsk-turisme?publisherId=17421123&releaseId=17605445
Wind Engineering case study – Lidars used to plan large bridge crossings
On the Norwegian west coast, several large bridges are being planned to replace ferries crossing the fjords. One of the most spectacular projects is the crossing of Sulafjorden, with large span in complex terrain.
At Sulafjorden, the planned bridge will be almost double the size of the worlds’ largest bridge, reaching a distance of 3.8 km, and the fjord has a maximum depth of 500 m. As a comparison, Norway’s longest suspension bridge, “Hardangerbrua”, is 1380 m. The world’s longest span of a bridge is 1991 m, located in Akashai, Japan. In addition, the bridge towers will stand out at a height of approximately 400 meters. The fjord is surrounded by mountains resulting in very complex wind conditions. Therefore, to map the conditions affecting the bridge construction, no less than 6 lidars are used, including 4 scanning lidars working in pairs, one lidar installed on a buoy and one lidar installed at the top of a 100 m mast, to extend the measurements to the top of the tall towers.
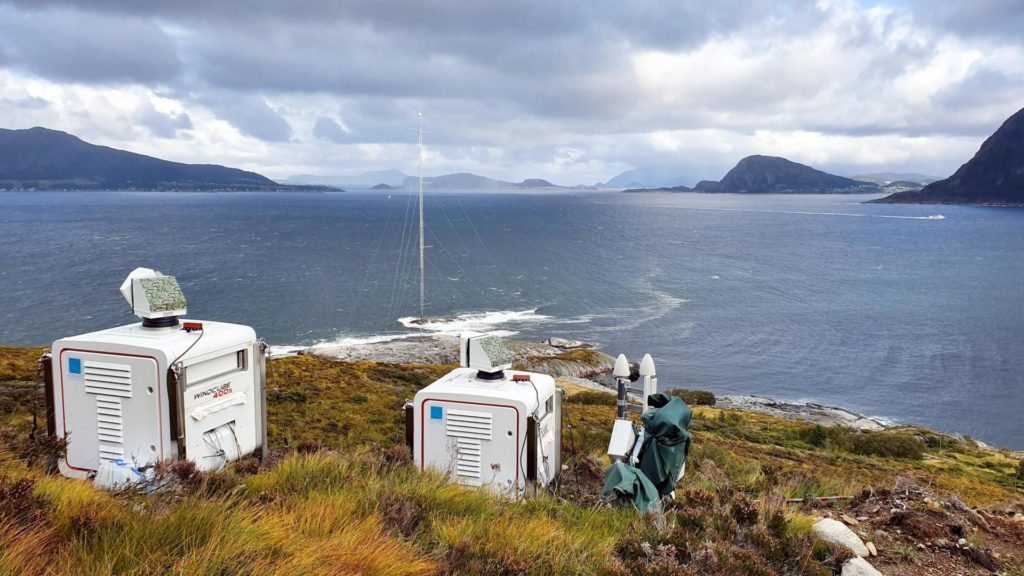
Picture showing two of the scanning lidars with the 90 m mast in the background. A vertical lidar is installed at the top of the mast.
Lidars in pairs
Ola Kaas Eriksen at Kjeller was in charge of the installation of the 4 scanning lidars and the vertical lidar in the mast. “The lidar pairs are positioned so that the laser beams intersect in the middle of the fjord in positions where the bridge deck is planned to be”, Ola says. He continues: “By using lidars in pairs, we managed to measure 2 dimensioned wind vectors in certain points, which cannot be done with only 1 lidar.” However, to enable the lidars to work in pair was not straight forward and some challenges were met. “To synchronize the lidars, we first tried to use available third-party software, however, this did not work sufficiently in line with our needs. Therefore, we needed to develop our own software in order to control the lidars to get good results for both windspeed and turbulence”, Ola says.
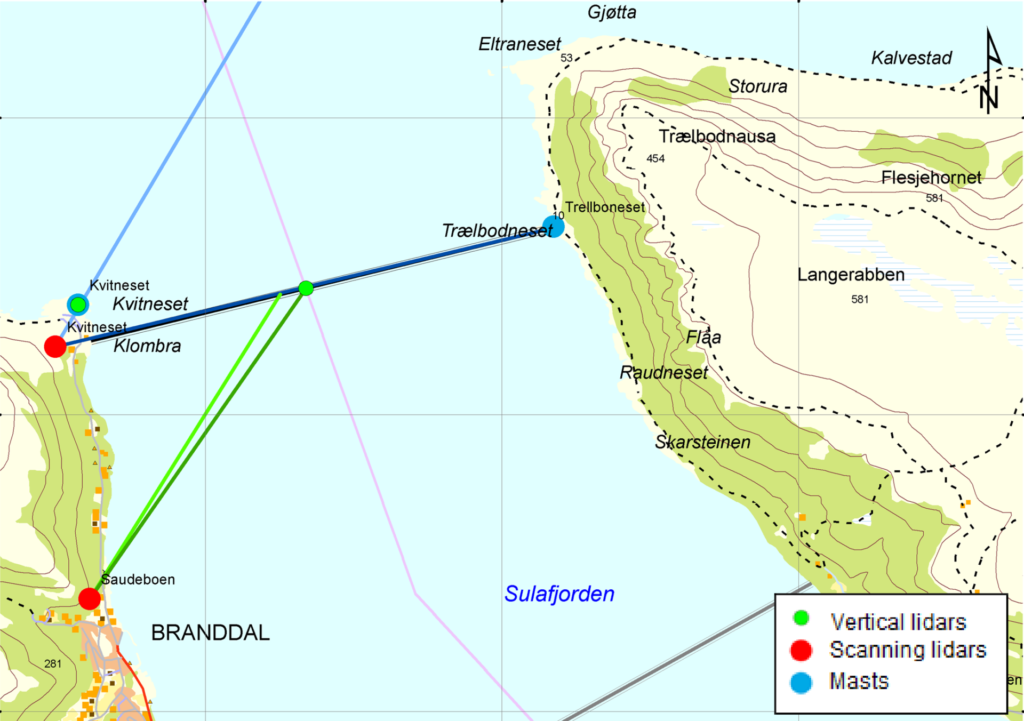
Showing the layout of the lidars.
Remote locations
To get the desired measurements, the scanning lidars needed to be placed remotely in the hills, which also resulted in a few challenges when it comes to the periodic lidar-services. Ola explains: “The service requires completely dry conditions. The solution was to first build a veranda up in the hillside, and then we were able to cover the area with a robust tent.”
All the materials and tools had to be brought up the hill by hand, so the work required some stamina. And of course, during the building, the famous west coast weather really showed its potential, as seen in the photo below. It shows that high quality measurements do not only require good equipment and accuracy, but also flexibility and a portion of hard work.
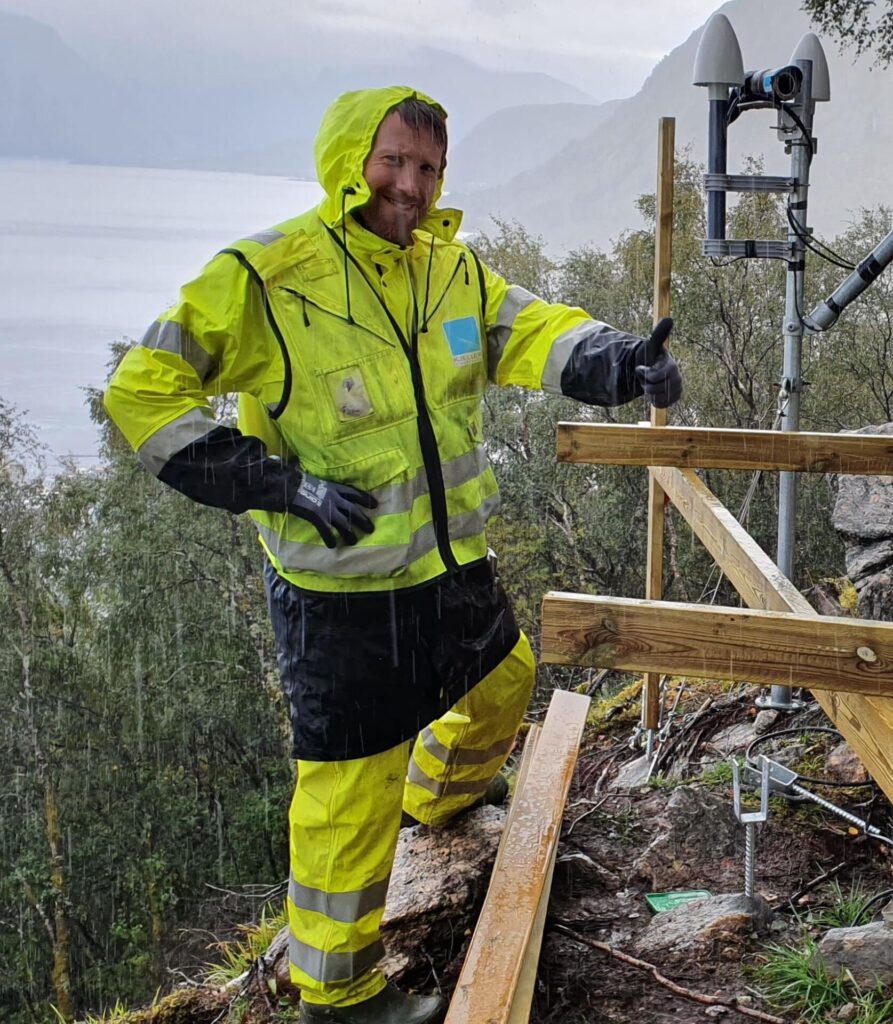
Ola Kaas Eriksen during the building of the veranda during heavy rainfall.
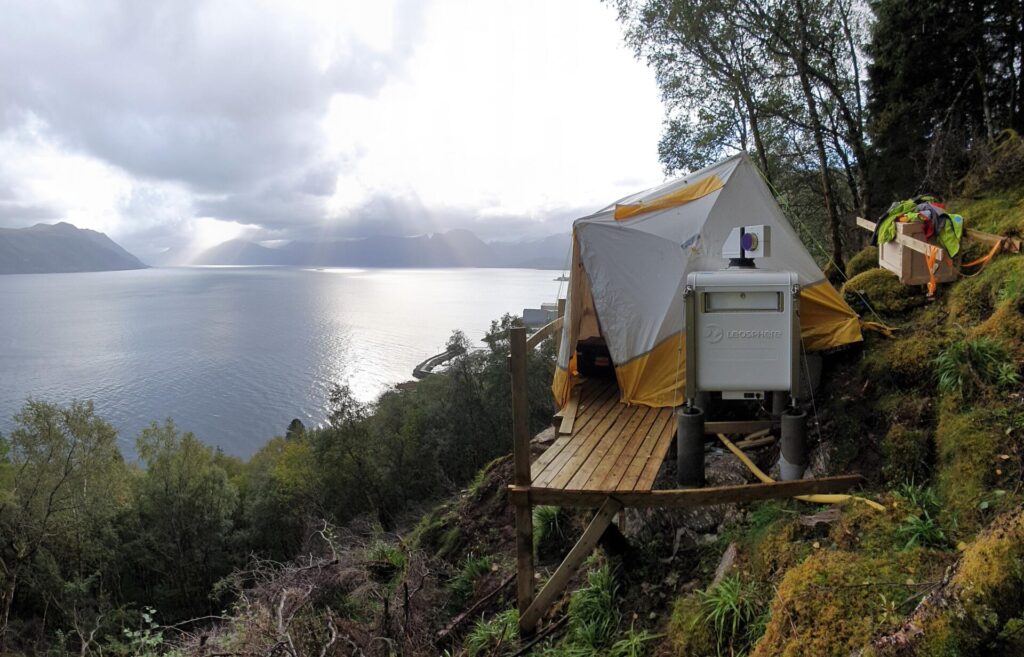
The finished veranda with the tent put up.
Advanced analyses
In addition to collecting data, KVT has also performed analyses, which Hálfdán Ágústsson was in charge of. He could confirm that the data from the scanning lidars have very high quality, which shows that the chosen method was a good choice. He says: “We see that the measured wind speed and wind direction has a very high quality, and despite the physical limits of the lidar, we are able to measure most of the turbulence. Only the part of the turbulence consisting of the highest frequencies are not measured, and the measured turbulence intensity is more than 90 % of the total, so we are very satisfied with the results”, he continues.
Has there been performed any validations against other instruments, and why and how is that performed?
“Yes, we have pointed the lidars towards masts with ultrasonic sensors to compare the windspeed and wind direction”, Hálfdán says. “The reason is to validate that everything has been done correctly during the installation and that no mistakes have been made. Despite that we needed to compare point measurements from ultrasonic sensors with volume measurements from the lidar, we received very good results”, he adds. Below, the wind velocity measured by two lidars working in pair is plotted against wind velocity measured by an ultrasonic sensor in a met mast.
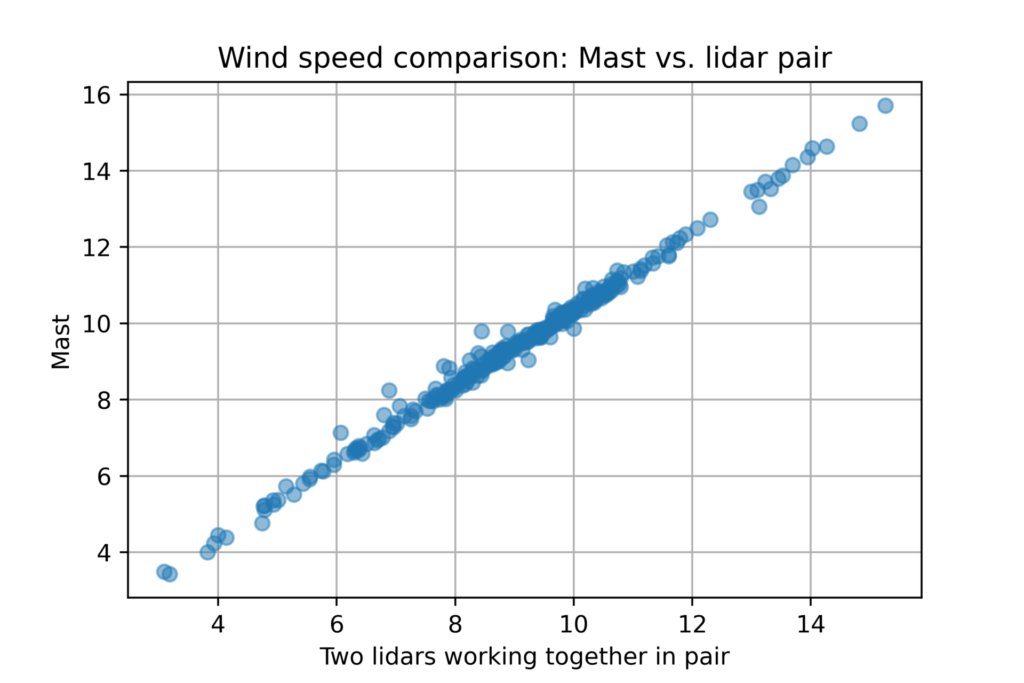
The wind velocities measured by two scanning lidars working as a pair plotted against wind velocities measured by an ultrasonic sensor in a met mast.
Hálfdán also explains why it is important to measure with the lidar in the top of the mast: “The lidar is located approximately 100 m above the ground and can measure up to 300 meters, reaching the top of the towers at 400 meters. We could estimate a vertical wind profile by using the windshear from the ultrasonic measurements, as usually. However, when we add the lidar, we see that the full picture can be completely different from the expected, due to the complex terrain.” The plots below show a couple of such examples, where the three lowest points, A, B and C are ultrasonic sensors in the met mast, while the rest of the points are measured by lidar.
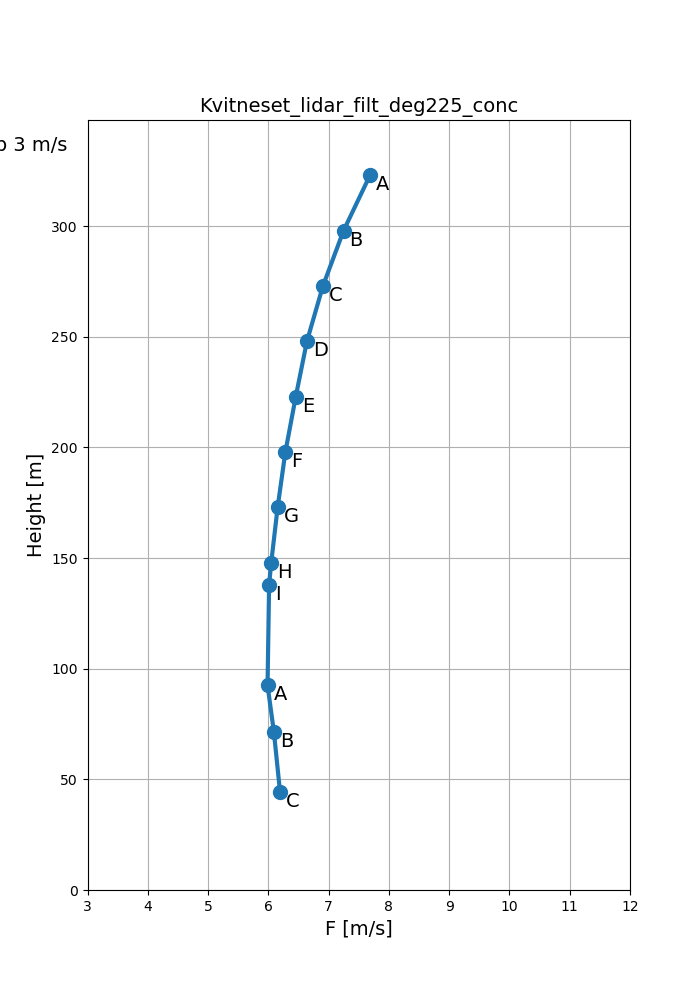
The vertical wind profile plotted for two different wind directions. The three lowest points are measured by ultrasonic sensors in a met mast, and the rest of the points are measured by a lidar. The plot shows that met mast measurements do not necessary show the entire picture, and measurements at higher altitudes are sometimes needed to know the wind velocities at higher altitudes.
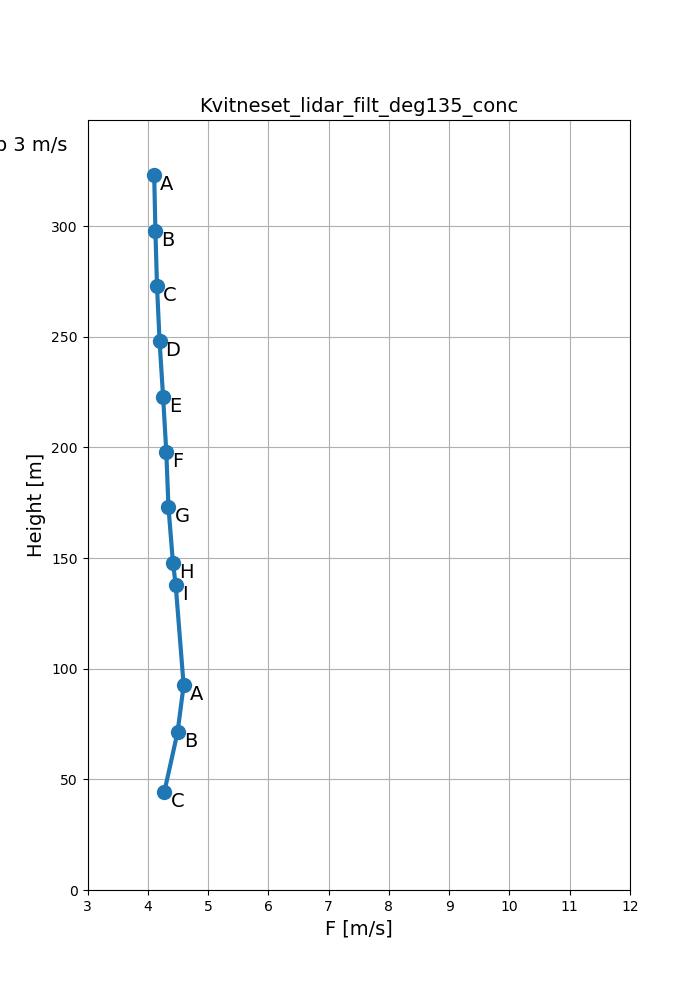
In addition to change in the velocity profile, by using lidar, we could also measure the wind veer or change in direction according to height. The plot below shows how the direction tends to change due to the terrain surrounding Kvitneset, especially the mountains south-west of the mast can be identified in the plot. The orographic forcing increases downwards from the highest measurement height. “These are effects that we would not be able to measure without lidars. We see that the wind direction at lower altitudes is more or less the same as the direction of the fjord. This is however not the case higher up”, Hálfdán says.
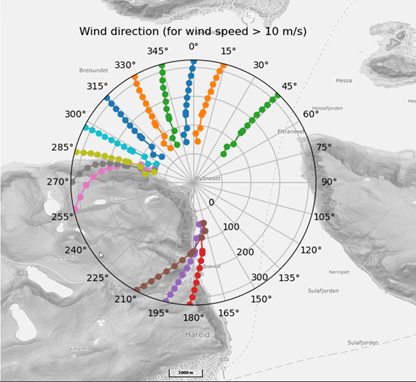
Wind veer measured by the lidar from different wind directions.
Summary
Kjeller Vindteknikk has performed multiple state-of-the-art lidar measurement campaigns for wind energy, airport and bridge design applications in the last 15 years. Lidars have improved their performance in the last years and in experienced hands, we see them as a key enabling technology delivering added value for various applications in the future.
Please contact us if you have any questions or want an offer from us for a lidar campaign!